Timeline of the 2002 Pacific hurricane season
| Timeline of the 2002 Pacific hurricane season | |||||||
|---|---|---|---|---|---|---|---|
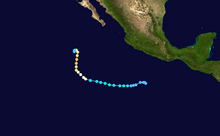
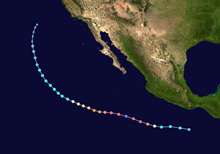
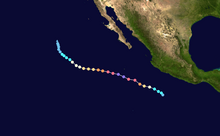
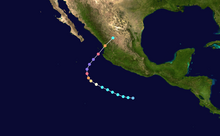
 Season summary map | |||||||
| Season boundaries | |||||||
| First system formed | May 24, 2002 | ||||||
| Last system dissipated | November 16, 2002 | ||||||
| Strongest system | |||||||
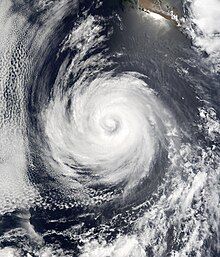
| Name | Kenna | ||||||
| Maximum winds | 270 km/h (165 mph) (1-minute sustained) | ||||||
| Lowest pressure | 913 hPa (mbar) | ||||||
| Longest lasting system | |||||||
| Name | Fausto | ||||||
| Duration | 11.50 days | ||||||
| |||||||
| Other years 2000, 2001, 2002, 2003, 2004 | |||||||
The 2002 Pacific hurricane season consisted of the events that occurred in the annual cycle of tropical cyclone formation over the Pacific Ocean north of the Equator and east of the International Date Line. The official bounds of each Pacific hurricane season are dates that conventionally delineate the period each year during which tropical cyclones tend to form in the basin according to the National Hurricane Center (NHC), beginning on May 15 in the Eastern Pacific proper (east of 140°W) and June 1 in the Central Pacific (140°W to the International Date Line), and ending on November 30 in both areas. However, tropical cyclogenesis is possible at any time of year.[1] The first tropical cyclone of the season, Hurricane Alma, developed on May 24; the final system, Tropical Depression Sixteen-E, dissipated on November 16.
Nineteen tropical depressions developed during the 2002 season, with fifteen further strengthening into named tropical storms;[nb 1] eight became hurricanes, of which six attained major hurricane status.[nb 2][2][3]: 2379 Activity was generally near normal, with the number of tropical storms and hurricanes matching the respective 1991–2020 averages; however, the number of major hurricanes was above the average of four for the same period.[1][3]: 2379 Hurricanes Elida, Hernan, and Kenna achieved Category 5 strength on the Saffir–Simpson scale, tying a record set in 1994 for the most storms to do so in one season since reliable records began in 1971.[4]
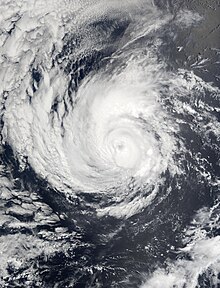
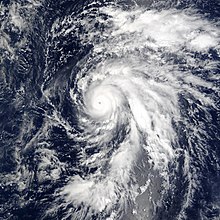
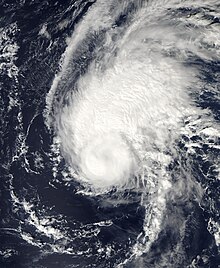
Hurricane Kenna in late October was by far the most impactful storm of the season. After weakening from its peak intensity—which was marked by a minimum barometric pressure of 913 mbar (26.96 inHg), making it the fourth-most intense Pacific hurricane on record[5]—Kenna made landfall on the coast of western Mexico at Category 4 status with maximum sustained winds of 140 mph (220 km/h). These winds, combined with a storm surge of up to 16 feet (4.9 m), devastated the area surrounding the fishing village of San Blas, Nayarit, where as many as 95% of homes were damaged or destroyed; four people were killed.[3]: 2390 [6] The name Kenna would later be retired on account of the hurricane's effects in Mexico.[7]
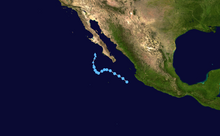
Aside from Kenna, effects on land were relatively light during the season. Tropical Storm Julio struck southern Mexico in late September, causing torrential rainfall; flash floods damaged structures, and slick roads contributed to a bus accident that killed three people.[8] Tropical Storms Boris and Iselle generated heavy rainfall in Mexico without coming ashore, while Tropical Depression Eleven-E prompted the issuance of a tropical storm warning and hurricane watch for portions of the Baja California peninsula but dissipated off the coast without impact.[9][10][11] Hurricanes Alma and Fausto were noted for unusual meteorological feats, though neither storm affected land; Alma followed 2001's Hurricane Adolph as only the second known Pacific major hurricane in the month of May,[12] while Fausto regenerated into a tropical storm far to the north of the Hawaiian Islands, where tropical cyclones are rarely observed.[2]
Four time zones are utilized in the Eastern Pacific basin. They are, from east to west: Central east of 106°W; Mountain from 106°W to 114.9°W; Pacific from 115°W to 139.9°W; and Hawaii−Aleutian from 140°W to the International Date Line. For convenience, each event is listed in Coordinated Universal Time (UTC) first, using the 24-hour clock (where 00:00 = midnight UTC),[13] with the respective local time included in parentheses. Figures for maximum sustained winds and position estimates are rounded to the nearest five units (knots, miles, or kilometers) and averaged over one minute, following National Hurricane Center practice. Direct wind observations are rounded to the nearest whole number. Atmospheric pressures are listed to the nearest millibar and nearest hundredth of an inch of mercury. This timeline documents the formation of tropical cyclones as well as the strengthening, weakening, landfalls, extratropical transitions, and dissipations during the season. It also includes information that was not released while the storm was active, meaning that data from post-storm reviews by the National Hurricane Center and the Central Pacific Hurricane Center is included.
Timeline of events

May
May 15
- The 2002 Eastern Pacific hurricane season officially begins.[1]
May 24
- 18:00 UTC (1:00 p.m. CDT) at 11°12′N 101°12′W / 11.2°N 101.2°W / 11.2; -101.2 (Tropical Depression One-E develops.) – Tropical Depression One-E forms from an area of low pressure about 560 mi (900 km) south-southeast of Manzanillo, Colima.[14]
May 26
- 12:00 UTC (7:00 a.m. CDT) at 10°42′N 104°54′W / 10.7°N 104.9°W / 10.7; -104.9 (One-E becomes Tropical Storm Alma.) – Tropical Depression One-E strengthens into Tropical Storm Alma about 655 mi (1,055 km) south of Manzanillo, Colima.[14]
May 28
- 18:00 UTC (12:00 p.m. MDT) at 12°06′N 113°30′W / 12.1°N 113.5°W / 12.1; -113.5 (Alma reaches Category 1 status.) – Tropical Storm Alma strengthens into a Category 1 hurricane about 785 mi (1,260 km) southwest of Manzanillo, Colima.[14]
May 29
- 18:00 UTC (11:00 a.m. PDT) at 13°54′N 115°24′W / 13.9°N 115.4°W / 13.9; -115.4 (Alma reaches Category 2 status.) – Hurricane Alma strengthens to Category 2 intensity about 815 mi (1,315 km) west-southwest of Manzanillo, Colima.[14]
May 30
- 06:00 UTC (11:00 p.m. PDT, May 29) at 15°18′N 115°24′W / 15.3°N 115.4°W / 15.3; -115.4 (Alma reaches Category 3 status and its peak intensity.) – Hurricane Alma strengthens to Category 3 intensity about 635 mi (1,020 km) southwest of Cabo San Lucas, Baja California Sur, making it the first major hurricane of the season; it simultaneously reaches maximum sustained winds of 115 mph (185 km/h) and a minimum barometric pressure of 960 mbar (28.35 inHg).[14]
- 18:00 UTC (11:00 a.m. PDT) at 16°54′N 115°12′W / 16.9°N 115.2°W / 16.9; -115.2 (Alma weakens to Category 2 status.) – Hurricane Alma weakens to Category 2 intensity about 535 mi (860 km) southwest of Cabo San Lucas, Baja California Sur.[14]
May 31
- 06:00 UTC (11:00 p.m. PDT, May 30) at 18°00′N 115°24′W / 18.0°N 115.4°W / 18.0; -115.4 (Alma weakens to Category 1 status.) – Hurricane Alma weakens to Category 1 intensity about 490 mi (790 km) southwest of Cabo San Lucas, Baja California Sur.[14]
- 12:00 UTC (5:00 a.m. PDT) at 18°00′N 115°42′W / 18.0°N 115.7°W / 18.0; -115.7 (Alma weakens into a tropical storm.) – Hurricane Alma weakens into a tropical storm about 500 mi (805 km) southwest of Cabo San Lucas, Baja California Sur.[14]
June
June 1
- The 2002 Central Pacific hurricane season officially begins.[1]
- 06:00 UTC (11:00 p.m. PDT, May 31) at 17°48′N 115°42′W / 17.8°N 115.7°W / 17.8; -115.7 (Alma weakens into a tropical depression.) – Tropical Storm Alma weakens into a tropical depression about 510 mi (825 km) southwest of Cabo San Lucas, Baja California Sur.[14]
- 18:00 UTC (11:00 a.m. PDT) at 17°48′N 115°42′W / 17.8°N 115.7°W / 17.8; -115.7 (Alma dissipates.) – Tropical Depression Alma degenerates into a remnant low about 510 mi (825 km) southwest of Cabo San Lucas, Baja California Sur.[14]
June 8
- 12:00 UTC (7:00 a.m. CDT) at 16°06′N 102°24′W / 16.1°N 102.4°W / 16.1; -102.4 (A tropical depression develops.) – A tropical depression forms from an area of disturbed weather about 175 mi (280 km) west-southwest of Acapulco, Guerrero.[9]
June 9
- 00:00 UTC (7:00 p.m. CDT, June 8) at 16°36′N 103°48′W / 16.6°N 103.8°W / 16.6; -103.8 (The tropical depression becomes Tropical Storm Boris.) – The tropical depression strengthens into Tropical Storm Boris about 175 mi (280 km) south-southeast of Manzanillo, Colima.[9]
- 06:00 UTC (1:00 a.m. CDT) at 16°48′N 104°06′W / 16.8°N 104.1°W / 16.8; -104.1 (Boris reaches its peak intensity.) – Tropical Storm Boris reaches maximum sustained winds of 60 mph (95 km/h) and a minimum barometric pressure of 997 mbar (29.44 inHg) about 155 mi (250 km) south of Manzanillo, Colima.[9]
June 10
- 18:00 UTC (1:00 p.m. CDT) at 17°06′N 103°42′W / 17.1°N 103.7°W / 17.1; -103.7 (Boris weakens into a tropical depression.) – Tropical Storm Boris weakens into a tropical depression about 115 mi (185 km) south-southeast of Manzanillo, Colima.[9]
June 11
- 18:00 UTC (1:00 p.m. CDT) at 17°00′N 103°12′W / 17.0°N 103.2°W / 17.0; -103.2 (Boris becomes a remnant low.) – Tropical Depression Boris degenerates into a remnant low about 160 mi (260 km) south-southeast of Manzanillo, Colima.[9]
June 27
- 12:00 UTC (5:00 a.m. PDT) at 11°48′N 121°54′W / 11.8°N 121.9°W / 11.8; -121.9 (Tropical Depression Three-E develops and reaches its peak winds.) – Tropical Depression Three-E forms from a tropical wave about 1,115 mi (1,800 km) southwest of the southern tip of the Baja California peninsula; it simultaneously reaches maximum sustained winds of 35 mph (55 km/h).[15]
June 28
- 06:00 UTC (11:00 p.m. PDT, June 27) at 12°18′N 125°42′W / 12.3°N 125.7°W / 12.3; -125.7 (Three-E reaches its lowest pressure.) – Tropical Depression Three-E reaches a minimum barometric pressure of 1,006 mbar (29.71 inHg) about 1,265 mi (2,040 km) southwest of the southern tip of the Baja California peninsula.[15]
June 29
- 06:00 UTC (11:00 p.m. PDT, June 28) at 12°48′N 133°06′W / 12.8°N 133.1°W / 12.8; -133.1 (Three-E dissipates.) – Tropical Depression Three-E is last noted as a tropical cyclone about 1,670 mi (2,685 km) west-southwest of the southern tip of the Baja California peninsula; it dissipates shortly thereafter.[15]
July
July 9
- 12:00 UTC (7:00 a.m. CDT) at 11°30′N 100°18′W / 11.5°N 100.3°W / 11.5; -100.3 (Tropical Depression Four-E develops.) – Tropical Depression Four-E forms from a tropical disturbance about 345 mi (555 km) south of Acapulco, Guerrero.[16]
July 12
- 06:00 UTC (12:00 a.m. MDT) at 14°12′N 113°36′W / 14.2°N 113.6°W / 14.2; -113.6 (Four-E becomes Tropical Storm Cristina.) – Tropical Depression Four-E strengthens into Tropical Storm Cristina about 645 mi (1,040 km) south-southwest of the southern tip of the Baja California peninsula.[16]

July 14
- 12:00 UTC (5:00 a.m. PDT) at 16°36′N 117°48′W / 16.6°N 117.8°W / 16.6; -117.8 (Cristina reaches its peak intensity.) – Tropical Storm Cristina reaches maximum sustained winds of 65 mph (100 km/h) and a minimum barometric pressure of 994 mbar (29.35 inHg) about 670 mi (1,075 km) southwest of the southern tip of the Baja California peninsula.[16]
July 15
- 12:00 UTC (5:00 a.m. PDT) at 18°30′N 119°24′W / 18.5°N 119.4°W / 18.5; -119.4 (Cristina weakens into a tropical depression.) – Tropical Storm Cristina weakens into a tropical depression about 680 mi (1,095 km) west-southwest of the southern tip of the Baja California peninsula.[16]
July 16
- 18:00 UTC (11:00 a.m. PDT) at 20°00′N 122°42′W / 20.0°N 122.7°W / 20.0; -122.7 (Cristina dissipates.) – Tropical Depression Cristina is last noted as a tropical cyclone about 840 mi (1,355 km) west-southwest of the southern tip of the Baja California peninsula; it dissipates six hours later.[16]
July 17
- 06:00 UTC (8:00 p.m. HST, July 16) at 9°18′N 178°06′W / 9.3°N 178.1°W / 9.3; -178.1 (The JTWC begins tracking a tropical depression.) – The Joint Typhoon Warning Center (JTWC) begins tracking a tropical depression over the extreme southwestern portion of the Central Pacific basin, though it is operationally classified as a tropical disturbance at the time.[17]: 102, 205
July 19

- 00:00 UTC (2:00 p.m. HST, July 18) at 14°42′N 177°30′W / 14.7°N 177.5°W / 14.7; -177.5 (The JTWC issues a TCFA for the depression.) – The JTWC issues a Tropical Cyclone Formation Alert for the aforementioned tropical depression.[17]: 102, 205
July 20
- 06:00 UTC (8:00 p.m. HST, July 19) at 16°06′N 179°36′W / 16.1°N 179.6°W / 16.1; -179.6 (The JMA begins tracking the depression.) – The Japan Meteorological Agency (JMA), which is the primary Regional Specialized Meteorological Centre for the Western Pacific basin, begins tracking the tropical depression over the extreme southwestern Central Pacific basin. One hour later, the JMA reports that the tropical depression has crossed the International Date Line; the agency soon upgrades it to Tropical Storm Kalmaegi.[18][19]
- 12:00 UTC (2:00 a.m. HST) at 16°30′N 179°24′E / 16.5°N 179.4°E / 16.5; 179.4 (The JTWC reports the depression crossing the International Date Line.) – The JTWC reports that the tropical depression has crossed the International Date Line; the agency issues its first official warning on the system six hours later, giving it the number 15W as part of the 2002 Pacific typhoon season.[17]: 102, 205
- 12:00 UTC (6:00 a.m. MDT) at 13°12′N 106°24′W / 13.2°N 106.4°W / 13.2; -106.4 (Tropical Depression Five-E develops.) – Tropical Depression Five-E forms from a tropical wave about 425 mi (685 km) south-southwest of Manzanillo, Colima.[20]
- 18:00 UTC (12:00 p.m. MDT) at 13°42′N 106°48′W / 13.7°N 106.8°W / 13.7; -106.8 (Five-E becomes Tropical Storm Douglas.) – Tropical Depression Five-E strengthens into Tropical Storm Douglas about 405 mi (650 km) south-southwest of Manzanillo, Colima.[20]
July 22
- 00:00 UTC (6:00 p.m. MDT, July 21) at 17°00′N 110°18′W / 17.0°N 110.3°W / 17.0; -110.3 (Douglas reaches Category 1 status.) – Tropical Storm Douglas strengthens into a Category 1 hurricane about 420 mi (675 km) west-southwest of Manzanillo, Colima.[20]
- 12:00 UTC (6:00 a.m. MDT) at 17°12′N 112°00′W / 17.2°N 112.0°W / 17.2; -112.0 (Douglas reaches Category 2 status.) – Hurricane Douglas strengthens to Category 2 intensity about 520 mi (835 km) west-southwest of Manzanillo, Colima.[20]
- 18:00 UTC (12:00 p.m. MDT) at 17°12′N 112°42′W / 17.2°N 112.7°W / 17.2; -112.7 (Douglas reaches its peak intensity.) – Hurricane Douglas reaches maximum sustained winds of 105 mph (165 km/h) and a minimum barometric pressure of 970 mbar (28.64 inHg) about 565 mi (910 km) west-southwest of Manzanillo, Colima.[20]
July 23
- 06:00 UTC (1:00 a.m. CDT) at 11°36′N 96°42′W / 11.6°N 96.7°W / 11.6; -96.7 (Tropical Depression Six-E develops.) – Tropical Depression Six-E forms from a tropical wave about 295 mi (475 km) south of Puerto Escondido, Oaxaca.[21]
- 12:00 UTC (7:00 a.m. CDT) at 11°54′N 98°30′W / 11.9°N 98.5°W / 11.9; -98.5 (Six-E becomes Tropical Storm Elida.) – Tropical Depression Six-E strengthens into Tropical Storm Elida about 290 mi (465 km) south-southwest of Puerto Escondido, Oaxaca.[21]
- 18:00 UTC (11:00 a.m. PDT) at 18°12′N 115°42′W / 18.2°N 115.7°W / 18.2; -115.7 (Douglas weakens to Category 1 status.) – Hurricane Douglas weakens to Category 1 intensity about 750 mi (1,205 km) west of Manzanillo, Colima.[20]
July 24
- 06:00 UTC (1:00 a.m. CDT) at 12°18′N 103°42′W / 12.3°N 103.7°W / 12.3; -103.7 (Elida reaches Category 1 status.) – Tropical Storm Elida strengthens into a Category 1 hurricane about 505 mi (815 km) west-southwest of Puerto Escondido, Oaxaca.[21]
- 12:00 UTC (7:00 a.m. CDT) at 12°42′N 105°06′W / 12.7°N 105.1°W / 12.7; -105.1 (Elida rapidly intensifies to Category 3 status.) – Hurricane Elida rapidly strengthens to Category 3 intensity, skipping Category 2 status, about 580 mi (935 km) west-southwest of Puerto Escondido, Oaxaca. This makes it the second major hurricane of the season.[21]
- 18:00 UTC (11:00 a.m. PDT) at 20°30′N 121°48′W / 20.5°N 121.8°W / 20.5; -121.8 (Douglas weakens into a tropical storm.) – Hurricane Douglas weakens into a tropical storm about 1,140 mi (1,835 km) west of Manzanillo, Colima.[20]
- 18:00 UTC (12:00 p.m. MDT) at 13°12′N 106°36′W / 13.2°N 106.6°W / 13.2; -106.6 (Elida reaches Category 4 status.) – Hurricane Elida strengthens to Category 4 intensity about 660 mi (1,065 km) west-southwest of Puerto Escondido, Oaxaca.[21]

July 25
- 06:00 UTC (12:00 a.m. MDT) at 14°18′N 109°30′W / 14.3°N 109.5°W / 14.3; -109.5 (Elida reaches Category 5 status and its peak intensity.) – Hurricane Elida strengthens to Category 5 intensity about 835 mi (1,345 km) west of Puerto Escondido, Oaxaca, making it the first of three such storms this season. It simultaneously reaches maximum sustained winds of 160 mph (260 km/h) and a minimum barometric pressure of 921 mbar (27.20 inHg).[21]
- 12:00 UTC (6:00 a.m. MDT) at 14°42′N 111°00′W / 14.7°N 111.0°W / 14.7; -111.0 (Elida weakens to Category 4 status.) – Hurricane Elida weakens to Category 4 intensity about 930 mi (1,500 km) west of Puerto Escondido, Oaxaca.[21]
July 26
- 00:00 UTC (5:00 p.m. PDT, July 25) at 21°00′N 131°18′W / 21.0°N 131.3°W / 21.0; -131.3 (Douglas weakens into a tropical depression.) – Tropical Storm Douglas weakens into a tropical depression about 1,755 mi (2,825 km) west of Manzanillo, Colima.[20]
- 00:00 UTC (6:00 p.m. MDT, July 25) at 15°06′N 113°48′W / 15.1°N 113.8°W / 15.1; -113.8 (Elida weakens to Category 3 status.) – Hurricane Elida weakens to Category 3 intensity about 1,115 mi (1,800 km) west of Puerto Escondido, Oaxaca.[21]
- 18:00 UTC (11:00 a.m. PDT) at 21°36′N 137°18′W / 21.6°N 137.3°W / 21.6; -137.3 (Douglas becomes a remnant low.) – Tropical Depression Douglas degenerates into a remnant low about 1,150 mi (1,855 km) east of the Hawaiian Islands.[20]
- 18:00 UTC (11:00 a.m. PDT) at 16°00′N 117°06′W / 16.0°N 117.1°W / 16.0; -117.1 (Elida weakens to Category 2 status.) – Hurricane Elida weakens to Category 2 intensity about 1,250 mi (2,010 km) south of Los Angeles, California.[21]
July 27
- 06:00 UTC (11:00 p.m. PDT, July 26) at 16°48′N 119°12′W / 16.8°N 119.2°W / 16.8; -119.2 (Elida weakens to Category 1 status.) – Hurricane Elida weakens to Category 1 intensity about 1,190 mi (1,920 km) south of Los Angeles, California.[21]
- 18:00 UTC (11:00 a.m. PDT) at 17°48′N 121°24′W / 17.8°N 121.4°W / 17.8; -121.4 (Elida weakens into a tropical storm.) – Hurricane Elida weakens into a tropical storm about 1,140 mi (1,835 km) south of Los Angeles, California.[21]
July 29
- 18:00 UTC (11:00 a.m. PDT) at 24°48′N 127°36′W / 24.8°N 127.6°W / 24.8; -127.6 (Elida weakens into a tropical depression.) – Tropical Storm Elida weakens into a tropical depression about 850 mi (1,370 km) southwest of Los Angeles, California.[21]
July 30
- 18:00 UTC (11:00 a.m. PDT) at 29°36′N 128°36′W / 29.6°N 128.6°W / 29.6; -128.6 (Elida becomes a remnant low.) – Tropical Depression Elida degenerates into a remnant low about 680 mi (1,095 km) west-southwest of Los Angeles, California.[21]
August
August 6
- 00:00 UTC (5:00 p.m. PDT, August 5) at 13°00′N 118°54′W / 13.0°N 118.9°W / 13.0; -118.9 (Tropical Depression Seven-E develops.) – Tropical Depression Seven-E forms from a tropical wave about 900 mi (1,445 km) southwest of the southern tip of the Baja California peninsula.[22]
- 06:00 UTC (11:00 p.m. PDT, August 5) at 13°54′N 119°48′W / 13.9°N 119.8°W / 13.9; -119.8 (Seven-E reaches its peak intensity.) – Tropical Depression Seven-E reaches maximum sustained winds of 35 mph (55 km/h) and a minimum barometric pressure of 1,008 mbar (29.77 inHg) about 890 mi (1,435 km) southwest of the southern tip of the Baja California peninsula.[22]
August 8

- 00:00 UTC (5:00 p.m. PDT, August 5) at 19°00′N 126°00′W / 19.0°N 126.0°W / 19.0; -126.0 (Seven-E dissipates.) – Tropical Depression Seven-E is last noted as a tropical cyclone about 1,070 mi (1,725 km) west-southwest of the southern tip of the Baja California peninsula; it dissipates six hours later.[22]
August 21
- 12:00 UTC (6:00 a.m. MDT) at 12°48′N 106°54′W / 12.8°N 106.9°W / 12.8; -106.9 (A tropical depression develops.) – A tropical depression forms from a tropical wave about 460 mi (740 km) south-southwest of Manzanillo, Colima.[23]
August 22
- 00:00 UTC (6:00 p.m. MDT, August 21) at 12°48′N 108°36′W / 12.8°N 108.6°W / 12.8; -108.6 (The depression becomes Tropical Storm Fausto.) – The aforementioned tropical depression strengthens into Tropical Storm Fausto about 520 mi (835 km) south-southwest of Manzanillo, Colima.[23]
- 18:00 UTC (12:00 p.m. MDT) at 13°42′N 112°18′W / 13.7°N 112.3°W / 13.7; -112.3 (Fausto reaches Category 1 status.) – Tropical Storm Fausto strengthens into a Category 1 hurricane about 650 mi (1,045 km) south-southwest of Cabo San Lucas, Baja California Sur.[23]
- 18:00 UTC (8:00 a.m. HST) at 10°42′N 142°42′W / 10.7°N 142.7°W / 10.7; -142.7 (Tropical Depression One-C develops.) – Tropical Depression One-C forms from an area of disturbed weather about 1,245 mi (2,000 km) southeast of Honolulu, Hawaii.[2]
August 23
- 12:00 UTC (5:00 a.m. PDT) at 14°42′N 116°30′W / 14.7°N 116.5°W / 14.7; -116.5 (Fausto reaches Category 2 status.) – Hurricane Fausto strengthens to Category 2 intensity about 710 mi (1,140 km) southwest of Cabo San Lucas, Baja California Sur.[23]
- 18:00 UTC (11:00 a.m. PDT) at 15°00′N 117°54′W / 15.0°N 117.9°W / 15.0; -117.9 (Fausto reaches Category 3 status.) – Hurricane Fausto strengthens to Category 3 intensity about 755 mi (1,215 km) southwest of Cabo San Lucas, Baja California Sur, making it the third major hurricane of the season.[23]
August 24
- 06:00 UTC (11:00 p.m. PDT, August 23) at 15°18′N 120°30′W / 15.3°N 120.5°W / 15.3; -120.5 (Fausto reaches Category 4 status.) – Hurricane Fausto strengthens to Category 4 intensity about 865 mi (1,390 km) southwest of Cabo San Lucas, Baja California Sur.[23]
- 12:00 UTC (5:00 a.m. PDT) at 15°42′N 121°48′W / 15.7°N 121.8°W / 15.7; -121.8 (Fausto reaches its peak intensity.) – Hurricane Fausto reaches maximum sustained winds of 145 mph (230 km/h) and a minimum barometric pressure of 936 mbar (27.64 inHg) about 915 mi (1,475 km) southwest of Cabo San Lucas, Baja California Sur.[23]
August 25
- 00:00 UTC (2:00 p.m. HST, August 24) at 12°12′N 150°42′W / 12.2°N 150.7°W / 12.2; -150.7 (One-C becomes Tropical Storm Alika.) – Tropical Depression One-C strengthens into Tropical Storm Alika about 790 mi (1,270 km) southeast of Honolulu, Hawaii.[2]
- 00:00 UTC (2:00 p.m. HST, August 24) at 9°48′N 157°36′W / 9.8°N 157.6°W / 9.8; -157.6 (Tropical Depression Two-C develops.) – Tropical Depression Two-C forms from an area of disturbed weather about 795 mi (1,280 km) south of Honolulu, Hawaii.[nb 3][5]
- 06:00 UTC (11:00 p.m. PDT, August 24) at 17°12′N 125°12′W / 17.2°N 125.2°W / 17.2; -125.2 (Fausto weakens to Category 3 status.) – Hurricane Fausto weakens to Category 3 intensity about 1,065 mi (1,715 km) west-southwest of Cabo San Lucas, Baja California Sur.[23]
- 06:00 UTC (8:00 p.m. HST, August 24) at 12°42′N 151°30′W / 12.7°N 151.5°W / 12.7; -151.5 (Alika reaches its peak intensity.) – Tropical Storm Alika reaches maximum sustained winds of 65 mph (100 km/h) and a minimum barometric pressure of 995 mbar (29.38 inHg) about 725 mi (1,165 km) southeast of Honolulu, Hawaii.[2]
- 12:00 UTC (5:00 a.m. PDT) at 17°48′N 126°30′W / 17.8°N 126.5°W / 17.8; -126.5 (Fausto weakens to Category 2 status.) – Hurricane Fausto weakens to Category 2 intensity about 1,130 mi (1,815 km) west-southwest of Cabo San Lucas, Baja California Sur.[23]
August 26
- 00:00 UTC (6:00 p.m. MDT, August 25) at 14°42′N 110°24′W / 14.7°N 110.4°W / 14.7; -110.4 (A tropical depression develops.) – A tropical depression forms from a tropical wave about 565 mi (910 km) south of the southern tip of the Baja California peninsula.[24]
- 06:00 UTC (11:00 p.m. PDT, August 25) at 20°12′N 130°42′W / 20.2°N 130.7°W / 20.2; -130.7 (Fausto weakens to Category 1 status.) – Hurricane Fausto weakens to Category 1 intensity about 1,345 mi (2,170 km) west of Cabo San Lucas, Baja California Sur.[23]
- 12:00 UTC (5:00 a.m. PDT) at 20°54′N 132°06′W / 20.9°N 132.1°W / 20.9; -132.1 (Fausto weakens into a tropical storm.) – Hurricane Fausto weakens into a tropical storm about 1,420 mi (2,290 km) west of Cabo San Lucas, Baja California Sur.[23]
August 27
- 00:00 UTC (2:00 p.m. HST, August 26) at 14°36′N 160°24′W / 14.6°N 160.4°W / 14.6; -160.4 (Alika weakens into a tropical depression.) – Tropical Storm Alika weakens into a tropical depression about 495 mi (795 km) south-southwest of Honolulu, Hawaii.[2]
- 00:00 UTC (6:00 p.m. MDT, August 26) at 14°00′N 113°12′W / 14.0°N 113.2°W / 14.0; -113.2 (The depression becomes Tropical Storm Genevieve.) – The tropical depression that had formed 24 hours earlier strengthens into Tropical Storm Genevieve about 650 mi (1,045 km) south-southwest of the southern tip of the Baja California peninsula.[24]
- 06:00 UTC (8:00 p.m. HST, August 26) at 10°12′N 168°42′W / 10.2°N 168.7°W / 10.2; -168.7 (Two-C becomes Tropical Storm Ele.) – Tropical Depression Two-C strengthens into Tropical Storm Ele about 1,055 mi (1,695 km) southwest of Honolulu, Hawaii.[2]
- 18:00 UTC (12:00 p.m. MDT) at 14°06′N 114°54′W / 14.1°N 114.9°W / 14.1; -114.9 (Genevieve reaches its peak winds.) – Tropical Storm Genevieve reaches maximum sustained winds of 70 mph (110 km/h) about 685 mi (1,105 km) south-southwest of the southern tip of the Baja California peninsula.[24]
- Just after 18:00 UTC (8:00 a.m. HST) near 24°18′N 139°48′W / 24.3°N 139.8°W / 24.3; -139.8 (Fausto enters the Central Pacific.) – Tropical Storm Fausto crosses into the Central Pacific basin about 1,170 mi (1,880 km) east of Honolulu, Hawaii.[23][2]
August 28

- 00:00 UTC (2:00 p.m. HST, August 27) at 25°18′N 141°12′W / 25.3°N 141.2°W / 25.3; -141.2 (Fausto weakens into a tropical depression.) – Tropical Storm Fausto weakens into a tropical depression about 1,095 mi (1,760 km) east-northeast of Honolulu, Hawaii.[23][2]
- 00:00 UTC (2:00 p.m. HST, August 27) at 9°42′N 173°12′W / 9.7°N 173.2°W / 9.7; -173.2 (Ele reaches Category 1 status.) – Tropical Storm Ele strengthens into a Category 1 hurricane about 1,295 mi (2,085 km) southwest of Honolulu, Hawaii.[2]
- 00:00 UTC (5:00 p.m. PDT, August 27) at 14°36′N 115°30′W / 14.6°N 115.5°W / 14.6; -115.5 (Genevieve reaches its lowest pressure.) – Tropical Storm Genevieve reaches a minimum barometric pressure of 989 mbar (29.21 inHg) about 680 mi (1,095 km) south-southwest of the southern tip of the Baja California peninsula.[24]
- 06:00 UTC (8:00 p.m. HST, August 27) at 16°12′N 168°54′W / 16.2°N 168.9°W / 16.2; -168.9 (Alika dissipates.) – Tropical Depression Alika is last noted as a tropical cyclone about 805 mi (1,295 km) west-southwest of Honolulu, Hawaii; it dissipates shortly thereafter.[2]
- 12:00 UTC (2:00 a.m HST) at 26°48′N 145°00′W / 26.8°N 145.0°W / 26.8; -145.0 (Fausto becomes a remnant low.) – Tropical Depression Fausto degenerates into a remnant low about 890 mi (1,435 km) east-northeast of Honolulu, Hawaii.[23][2]
August 29
- 06:00 UTC (8:00 p.m. HST, August 28) at 10°54′N 178°00′W / 10.9°N 178.0°W / 10.9; -178.0 (Ele reaches Category 2 status.) – Hurricane Ele strengthens to Category 2 intensity about 1,515 mi (2,435 km) west-southwest of Honolulu, Hawaii.[2]
- 18:00 UTC (8:00 a.m. HST) at 11°42′N 179°12′W / 11.7°N 179.2°W / 11.7; -179.2 (Ele reaches Category 3 status.) – Hurricane Ele strengthens to Category 3 intensity about 1,560 mi (2,510 km) west-southwest of Honolulu, Hawaii, making it the fourth major hurricane of the season.[2]
August 30
- 00:00 UTC (2:00 p.m. HST) at 12°06′N 179°54′W / 12.1°N 179.9°W / 12.1; -179.9 (Ele approaches the International Date Line.) – Hurricane Ele reaches sustained winds of 125 mph (205 km/h) and a barometric pressure of 945 mbar (27.91 inHg) about 1,590 mi (2,555 km) west-southwest of Honolulu, Hawaii. This is Ele's peak intensity while in the Central Pacific basin; it crosses the International Date Line shortly afterwards and is re-designated as Typhoon Ele in the Western Pacific basin.[2]
- 06:00 UTC (1:00 a.m. CDT) at 13°30′N 103°06′W / 13.5°N 103.1°W / 13.5; -103.1 (A tropical depression develops.) – A tropical depression forms from an interaction between a tropical wave and the Intertropical Convergence Zone about 390 mi (630 km) south-southeast of Manzanillo, Colima.[25]
- 12:00 UTC (5:00 a.m. PDT) at 20°12′N 122°42′W / 20.2°N 122.7°W / 20.2; -122.7 (Genevieve weakens into a tropical depression.) – Tropical Storm Genevieve weakens into a tropical depression about 840 mi (1,355 km) west-southwest of the southern tip of the Baja California peninsula.[24]
- 12:00 UTC (7:00 a.m. CDT) at 13°54′N 103°24′W / 13.9°N 103.4°W / 13.9; -103.4 (The depression becomes Tropical Storm Hernan.) – The tropical depression that formed six hours earlier strengthens into Tropical Storm Hernan about 365 mi (585 km) south of Manzanillo, Colima.[25]
- 18:00 UTC (8:00 a.m. HST) at 30°00′N 157°18′W / 30.0°N 157.3°W / 30.0; -157.3 (Fausto regenerates.) – The remnants of Fausto regenerate into a tropical depression about 600 mi (965 km) north of Honolulu, Hawaii.[23][2]
August 31
- 06:00 UTC (1:00 a.m. CDT) at 15°06′N 105°48′W / 15.1°N 105.8°W / 15.1; -105.8 (Hernan reaches Category 1 status.) – Tropical Storm Hernan strengthens into a Category 1 hurricane about 290 mi (465 km) south-southwest of Manzanillo, Colima.[25]
- 12:00 UTC (6:00 a.m. MDT) at 15°18′N 106°54′W / 15.3°N 106.9°W / 15.3; -106.9 (Hernan reaches Category 2 status.) – Hurricane Hernan strengthens to Category 2 intensity about 310 mi (500 km) southwest of Manzanillo, Colima.[25]
- 18:00 UTC (12:00 p.m. MDT) at 15°42′N 107°48′W / 15.7°N 107.8°W / 15.7; -107.8 (Hernan reaches Category 3 status.) – Hurricane Hernan strengthens to Category 3 intensity about 330 mi (530 km) southwest of Manzanillo, Colima, making it the fifth major hurricane of the season.[25]
September
September 1

- 00:00 UTC (2:00 p.m. HST, August 31) at 33°18′N 163°48′W / 33.3°N 163.8°W / 33.3; -163.8 (Fausto reaches a secondary pressure minimum.) – The barometric pressure of Tropical Depression Fausto reaches a secondary minimum of 1,009 mbar (29.80 inHg) about 905 mi (1,455 km) north-northwest of Honolulu, Hawaii.[23][2]
- 00:00 UTC (6:00 p.m. MDT, August 31) at 16°30′N 108°48′W / 16.5°N 108.8°W / 16.5; -108.8 (Hernan reaches Category 4 status.) – Hurricane Hernan strengthens to Category 4 intensity about 345 mi (555 km) west-southwest of Manzanillo, Colima.[25]
- 06:00 UTC (11:00 p.m. PDT, August 31) at 24°54′N 127°00′W / 24.9°N 127.0°W / 24.9; -127.0 (Genevieve dissipates.) – Tropical Depression Genevieve is last noted as a tropical cyclone about 1,080 mi (1,740 km) west of the southern tip of the Baja California peninsula; it dissipates shortly thereafter.[24]
- 12:00 UTC (6:00 a.m. MDT) at 17°42′N 111°06′W / 17.7°N 111.1°W / 17.7; -111.1 (Hernan reaches Category 5 status and its peak intensity.) – Hurricane Hernan strengthens to Category 5 intensity about 395 mi (640 km) south of the southern tip of the Baja California peninsula, becoming the second of three such storms this season. It simultaneously reaches maximum sustained winds of 160 mph (260 km/h) and a minimum barometric pressure of 921 mbar (27.20 inHg).[25]
- 18:00 UTC (8:00 a.m. HST) at 34°36′N 167°24′W / 34.6°N 167.4°W / 34.6; -167.4 (Fausto regains tropical storm status.) – Tropical Depression Fausto restrengthens into a tropical storm about 1,090 mi (1,750 km) northwest of Honolulu, Hawaii; its sustained winds simultaneously reach a secondary peak of 40 mph (65 km/h).[23][2]
September 2
- 00:00 UTC (6:00 p.m. MDT, September 1) at 17°54′N 113°18′W / 17.9°N 113.3°W / 17.9; -113.3 (Hernan weakens to Category 4 status.) – Hurricane Hernan weakens to Category 4 intensity about 410 mi (660 km) south-southwest of the southern tip of the Baja California peninsula.[25]
- 12:00 UTC (5:00 a.m. PDT) at 18°24′N 115°24′W / 18.4°N 115.4°W / 18.4; -115.4 (Hernan weakens to Category 3 status.) – Hurricane Hernan weakens to Category 3 intensity about 465 mi (750 km) southwest of the southern tip of the Baja California peninsula.[25]
September 3
- 00:00 UTC (2:00 p.m. HST, September 2) at 43°06′N 169°48′W / 43.1°N 169.8°W / 43.1; -169.8 (Fausto dissipates.) – Tropical Storm Fausto is last noted as a tropical cyclone about 1,655 mi (2,670 km) north-northwest of Honolulu, Hawaii; it is absorbed by an extratropical cyclone six hours later.[23][2]
- 00:00 UTC (5:00 p.m. PDT, September 2) at 18°42′N 117°18′W / 18.7°N 117.3°W / 18.7; -117.3 (Hernan weakens to Category 2 status.) – Hurricane Hernan weakens to Category 2 intensity about 550 mi (890 km) west-southwest of the southern tip of the Baja California peninsula.[25]
- 18:00 UTC (11:00 a.m. PDT) at 19°12′N 120°06′W / 19.2°N 120.1°W / 19.2; -120.1 (Hernan weakens to Category 1 status.) – Hurricane Hernan weakens to Category 1 intensity about 700 mi (1,130 km) west-southwest of the southern tip of the Baja California peninsula.[25]
September 4
- 12:00 UTC (5:00 a.m. PDT) at 20°42′N 122°06′W / 20.7°N 122.1°W / 20.7; -122.1 (Hernan weakens into a tropical storm.) – Hurricane Hernan weakens into a tropical storm about 795 mi (1,280 km) west-southwest of the southern tip of the Baja California peninsula.[25]
September 5
- 12:00 UTC (5:00 a.m. PDT) at 22°18′N 124°06′W / 22.3°N 124.1°W / 22.3; -124.1 (Hernan weakens into a tropical depression.) – Tropical Storm Hernan weakens into a tropical depression about 905 mi (1,455 km) west of the southern tip of the Baja California peninsula.[25]
- 18:00 UTC (12:00 p.m. MDT) at 18°54′N 107°12′W / 18.9°N 107.2°W / 18.9; -107.2 (Tropical Depression Eleven-E develops.) – Tropical Depression Eleven-E forms from an area of unsettled weather about 140 mi (220 km) southwest of Cabo Corrientes, Jalisco.[11]
September 6
- 00:00 UTC (6:00 p.m. MDT, September 5) at 19°36′N 108°00′W / 19.6°N 108.0°W / 19.6; -108.0 (Eleven-E reaches its peak winds.) – Tropical Depression Eleven-E reaches maximum sustained winds of 35 mph (55 km/h) about 160 mi (260 km) west-southwest of Cabo Corrientes, Jalisco.[11]
- 18:00 UTC (11:00 a.m. PDT) at 24°30′N 124°42′W / 24.5°N 124.7°W / 24.5; -124.7 (Hernan becomes a remnant low.) – Tropical Depression Hernan degenerates into a remnant low about 940 mi (1,510 km) west of the southern tip of the Baja California peninsula.[25]
September 7
- 06:00 UTC (12:00 a.m. MDT) at 21°24′N 111°48′W / 21.4°N 111.8°W / 21.4; -111.8 (Eleven-E reaches its lowest pressure.) – Tropical Depression Eleven-E reaches a minimum barometric pressure of 1,006 mbar (29.71 inHg) about 155 mi (250 km) southwest of the southern tip of the Baja California peninsula.[11]
September 8
- 18:00 UTC (12:00 p.m. MDT) at 22°18′N 114°00′W / 22.3°N 114.0°W / 22.3; -114.0 (Eleven-E becomes a remnant low.) – Tropical Depression Eleven-E degenerates into a remnant low about 260 mi (415 km) west of the southern tip of the Baja California peninsula.[11]
September 15
- 06:00 UTC (1:00 a.m. CDT) at 15°12′N 103°48′W / 15.2°N 103.8°W / 15.2; -103.8 (A tropical depression develops.) – A tropical depression forms from a tropical wave about 270 mi (435 km) south of Manzanillo, Colima.[10]
September 16
- 00:00 UTC (6:00 p.m. MDT, September 15) at 16°54′N 106°48′W / 16.9°N 106.8°W / 16.9; -106.8 (The depression becomes Tropical Storm Iselle.) – The aforementioned tropical depression strengthens into Tropical Storm Iselle about 220 mi (350 km) southwest of Manzanillo, Colima.[10]
September 17
- 18:00 UTC (12:00 p.m. MDT) at 21°36′N 114°00′W / 21.6°N 114.0°W / 21.6; -114.0 (Iselle reaches its peak intensity.) – Tropical Storm Iselle reaches maximum sustained winds of 70 mph (110 km/h) and a minimum barometric pressure of 990 mbar (29.23 inHg) about 270 mi (435 km) west-southwest of Cabo San Lucas, Baja California Sur.[10]
September 19
- 18:00 UTC (12:00 p.m. MDT) at 23°48′N 112°30′W / 23.8°N 112.5°W / 23.8; -112.5 (Iselle weakens into a tropical depression.) – Tropical Storm Iselle weakens into a tropical depression about 65 mi (100 km) southwest of Puerto Cortés, Baja California Sur.[10]
September 20
- 06:00 UTC (12:00 a.m. MDT) at 24°30′N 112°48′W / 24.5°N 112.8°W / 24.5; -112.8 (Iselle becomes a remnant low.) – Tropical Depression Iselle degenerates into a remnant low about 65 mi (100 km) west of Puerto Cortés, Baja California Sur.[10]
September 25
- 00:00 UTC (7:00 p.m. CDT, September 24) at 14°36′N 101°48′W / 14.6°N 101.8°W / 14.6; -101.8 (A tropical depression develops.) – A tropical depression forms from an area of unsettled weather about 200 mi (325 km) southwest of Acapulco, Guerrero.[26]
- 12:00 UTC (7:00 a.m. CDT) at 16°06′N 101°36′W / 16.1°N 101.6°W / 16.1; -101.6 (The depression becomes Tropical Storm Julio.) – The tropical depression strengthens into Tropical Storm Julio about 125 mi (205 km) west-southwest of Acapulco, Guerrero.[26]
- 18:00 UTC (1:00 p.m. CDT) at 17°00′N 101°54′W / 17.0°N 101.9°W / 17.0; -101.9 (Julio reaches its peak winds.) – Tropical Storm Julio reaches maximum sustained winds of 45 mph (75 km/h) about 70 mi (110 km) south-southwest of Lázaro Cárdenas, Michoacán.[26]
September 26

- 00:00 UTC (7:00 p.m. CDT, September 25) at 18°00′N 102°24′W / 18.0°N 102.4°W / 18.0; -102.4 (Julio makes landfall and reaches its lowest pressure.) – Tropical Storm Julio makes landfall a short distance west-northwest of Lázaro Cárdenas, Michoacán, with sustained winds of 45 mph (75 km/h); it simultaneously reaches a minimum barometric pressure of 1,000 mbar (29.53 inHg).[26]
- 12:00 UTC (7:00 a.m. CDT) at 19°24′N 104°18′W / 19.4°N 104.3°W / 19.4; -104.3 (Julio weakens into a tropical depression over land before dissipating.) – Tropical Storm Julio weakens into a tropical depression inland about 25 mi (35 km) north of Manzanillo, Colima; it dissipates six hours later while continuing northwestward.[26]
October
October 22
- 00:00 UTC (7:00 p.m. CDT, October 21) at 11°24′N 99°24′W / 11.4°N 99.4°W / 11.4; -99.4 (A tropical depression develops.) – A tropical depression forms from an area of unsettled weather about 380 mi (610 km) south of Acapulco, Guerrero.[27]
- 06:00 UTC (1:00 a.m. CDT) at 11°30′N 100°24′W / 11.5°N 100.4°W / 11.5; -100.4 (The depression becomes Tropical Storm Kenna.) – The aforementioned tropical depression strengthens into Tropical Storm Kenna about 375 mi (600 km) south of Acapulco, Guerrero.[27]
- 18:00 UTC (11:00 a.m. PDT) at 11°00′N 130°30′W / 11.0°N 130.5°W / 11.0; -130.5 (Another tropical depression develops.) – Another tropical depression forms from an area of unsettled weather over the western part of the Eastern Pacific basin.[28]
October 23
- 06:00 UTC (11:00 p.m. PDT, October 22) at 11°48′N 130°30′W / 11.8°N 130.5°W / 11.8; -130.5 (The depression becomes Tropical Storm Lowell.) – The aforementioned tropical depression strengthens into Tropical Storm Lowell.[28]
- 12:00 UTC (5:00 a.m. PDT) at 12°42′N 141°00′W / 12.7°N 141.0°W / 12.7; -141.0 (Lowell reaches its lowest pressure and initial wind peak.) – Tropical Storm Lowell reaches a minimum barometric pressure of 1,002 mbar (29.59 inHg) and initial peak sustained winds of 45 mph (75 km/h).[28]
- 18:00 UTC (12:00 p.m. MDT) at 14°12′N 106°54′W / 14.2°N 106.9°W / 14.2; -106.9 (Kenna reaches Category 1 status.) – Tropical Storm Kenna strengthens into a Category 1 hurricane about 435 mi (705 km) south of Cabo Corrientes, Jalisco.[27]
- 18:00 UTC (8:00 a.m. HST) at 8°42′N 153°48′W / 8.7°N 153.8°W / 8.7; -153.8 (Tropical Depression Three-C develops.) – Tropical Depression Three-C forms from an area of unsettled weather within a large monsoonal trough about 1,195 mi (1,925 km) east-southeast of Johnston Atoll.[nb 4][5]
October 24

- 00:00 UTC (6:00 p.m. MDT, October 23) at 14°54′N 108°00′W / 14.9°N 108.0°W / 14.9; -108.0 (Kenna reaches Category 2 status.) – Hurricane Kenna strengthens to Category 2 intensity about 410 mi (660 km) south-southwest of Cabo Corrientes, Jalisco.[27]
- 06:00 UTC (12:00 a.m. MDT) at 15°30′N 108°30′W / 15.5°N 108.5°W / 15.5; -108.5 (Kenna reaches Category 3 status.) – Hurricane Kenna strengthens to Category 3 intensity about 385 mi (620 km) south-southwest of Cabo Corrientes, Jalisco, making it the sixth and final major hurricane of the season.[27]
- 12:00 UTC (6:00 a.m. MDT) at 16°24′N 108°48′W / 16.4°N 108.8°W / 16.4; -108.8 (Kenna reaches Category 4 status.) – Hurricane Kenna strengthens to Category 4 intensity about 345 mi (555 km) southwest of Cabo Corrientes, Jalisco.[27]
- 18:00 UTC (12:00 p.m. MDT) at 17°18′N 108°48′W / 17.3°N 108.8°W / 17.3; -108.8 (Kenna reaches Category 5 status.) – Hurricane Kenna strengthens to Category 5 intensity about 295 mi (475 km) southwest of Cabo Corrientes, Jalisco, making it the record-tying third such storm this season.[27]
- 18:00 UTC (11:00 a.m. PDT) at 12°18′N 135°30′W / 12.3°N 135.5°W / 12.3; -135.5 (Lowell weakens into a tropical depression.) – Tropical Storm Lowell weakens into a tropical depression.[28]
October 25
- 00:00 UTC (6:00 p.m. MDT, October 24) at 18°18′N 108°18′W / 18.3°N 108.3°W / 18.3; -108.3 (Kenna reaches its peak intensity as the strongest storm of the season.) – Hurricane Kenna reaches maximum sustained winds of 165 mph (270 km/h) and a minimum barometric pressure of 913 mbar (26.96 inHg) about 225 mi (360 km) southwest of Cabo Corrientes, Jalisco, making it the strongest storm of the season.[27]
- 12:00 UTC (6:00 a.m. MDT) at 20°24′N 106°30′W / 20.4°N 106.5°W / 20.4; -106.5 (Kenna weakens to Category 4 status.) – Hurricane Kenna weakens to Category 4 intensity about 50 mi (85 km) west of Cabo Corrientes, Jalisco.[27]
- 16:30 UTC (11:30 a.m. CDT) at 21°42′N 105°24′W / 21.7°N 105.4°W / 21.7; -105.4 (Kenna makes landfall.) – Hurricane Kenna makes landfall near San Blas, Nayarit, with sustained winds of 140 mph (220 km/h) and a barometric pressure of 950 mbar (28.05 inHg).[27]
- 18:00 UTC (1:00 p.m. CDT) at 22°06′N 105°06′W / 22.1°N 105.1°W / 22.1; -105.1 (Kenna weakens to Category 3 status.) – Hurricane Kenna weakens to Category 3 intensity inland about 40 mi (65 km) north-northeast of San Blas, Nayarit.[27]
October 26
- 00:00 UTC (7:00 p.m. CDT, October 25) at 23°42′N 103°30′W / 23.7°N 103.5°W / 23.7; -103.5 (Kenna weakens into a tropical storm and then dissipates.) – Hurricane Kenna drastically weakens into a tropical storm, skipping both Category 2 and Category 1 status, inland about 190 mi (305 km) northeast of San Blas, Nayarit; it dissipates six hours later.[27]
- 00:00 UTC (2:00 p.m. HST, October 25) at 12°42′N 140°30′W / 12.7°N 140.5°W / 12.7; -140.5 (Lowell enters the Central Pacific.) – Tropical Depression Lowell crosses into the Central Pacific basin.[2][28]
- 00:00 UTC (2:00 p.m. HST, October 25) at 10°48′N 154°54′W / 10.8°N 154.9°W / 10.8; -154.9 (Three-C becomes Tropical Storm Huko.) – Tropical Depression Three-C strengthens into Tropical Storm Huko about 1,065 mi (1,715 km) east-southeast of Johnston Atoll.[2]
October 27
- 18:00 UTC (8:00 a.m. HST) at 12°48′N 144°06′W / 12.8°N 144.1°W / 12.8; -144.1 (Lowell regains tropical storm status.) – Tropical Depression Lowell restrengthens into a tropical storm.[2][28]

October 28
- 12:00 UTC (2:00 a.m. HST) at 13°18′N 144°54′W / 13.3°N 144.9°W / 13.3; -144.9 (Lowell reaches its peak winds.) – Tropical Storm Lowell reaches maximum sustained winds of 50 mph (85 km/h) and reattains its minimum barometric pressure of 1,002 mbar (29.59 inHg).[2][28]
- 18:00 UTC (8:00 a.m. HST) at 12°48′N 159°24′W / 12.8°N 159.4°W / 12.8; -159.4 (Huko reaches Category 1 status and its initial peak intensity.) – Tropical Storm Huko strengthens into a Category 1 hurricane about 730 mi (1,175 km) east-southeast of Johnston Atoll; it simultaneously reaches its initial peak intensity with sustained winds of 75 mph (120 km/h) and a barometric pressure of 987 mbar (29.15 inHg).[2]
October 29
- 12:00 UTC (2:00 a.m. HST) at 12°18′N 147°00′W / 12.3°N 147.0°W / 12.3; -147.0 (Lowell weakens into a tropical depression again.) – Tropical Storm Lowell weakens back into a tropical depression.[2][28]
October 30
- 00:00 UTC (2:00 p.m. HST, October 29) at 14°00′N 161°18′W / 14.0°N 161.3°W / 14.0; -161.3 (Huko weakens into a tropical storm.) – Hurricane Huko weakens into a tropical storm about 580 mi (935 km) east-southeast of Johnston Atoll.[2]
- 06:00 UTC (8:00 p.m. HST, October 29) at 34°24′N 178°18′W / 34.4°N 178.3°W / 34.4; -178.3 (Tropical Storm Maysak enters the Central Pacific basin shortly before becoming extratropical.) – The JMA reports that Tropical Storm Maysak has crossed the International Date Line and entered the Central Pacific basin while still a tropical storm. Around this time or shortly thereafter, the JMA declares that the system has transitioned into an extratropical cyclone.[29][30]
October 31
- 00:00 UTC (2:00 p.m. HST, October 30) at 11°12′N 149°12′W / 11.2°N 149.2°W / 11.2; -149.2 (Lowell dissipates.) – Tropical Depression Lowell is last noted as a tropical cyclone; it dissipates a short time later.[2][28]
- 06:00 UTC (8:00 p.m. HST, October 30) at 13°48′N 166°12′W / 13.8°N 166.2°W / 13.8; -166.2 (Huko regains Category 1 status.) – Tropical Storm Huko reattains Category 1 hurricane strength about 300 mi (480 km) southeast of Johnston Atoll.[2]
November
November 1
- 12:00 UTC (2:00 a.m. HST) at 14°06′N 171°24′W / 14.1°N 171.4°W / 14.1; -171.4 (Huko reaches its peak winds.) – Hurricane Huko reaches maximum sustained winds of 85 mph (140 km/h) about 220 mi (350 km) southwest of Johnston Atoll.[2]
- 18:00 UTC (8:00 a.m. HST) at 14°36′N 172°00′W / 14.6°N 172.0°W / 14.6; -172.0 (Huko reaches its lowest pressure.) – Hurricane Huko reaches a minimum barometric pressure of 980 mbar (28.94 inHg) about 220 mi (350 km) southwest of Johnston Atoll.[2]
November 3
- 12:00 UTC (2:00 a.m. HST) at 15°42′N 179°48′E / 15.7°N 179.8°E / 15.7; 179.8 (Huko exits the basin.) – Hurricane Huko crosses the International Date Line, becoming Typhoon Huko in the Western Pacific basin.[nb 5]
November 14
- 00:00 UTC (5:00 p.m. MST,[nb 6] November 13) at 15°06′N 109°54′W / 15.1°N 109.9°W / 15.1; -109.9 (Tropical Depression Sixteen-E develops.) – Tropical Depression Sixteen-E forms about 540 mi (870 km) south of the southern tip of the Baja California peninsula.[34]
- 06:00 UTC (11:00 p.m. MST, November 13) at 15°12′N 111°00′W / 15.2°N 111.0°W / 15.2; -111.0 (Sixteen-E reaches its peak winds.) – Tropical Depression Sixteen-E reaches maximum sustained winds of 35 mph (55 km/h) about 535 mi (860 km) south of the southern tip of the Baja California peninsula.[34]
November 15
- 12:00 UTC (5:00 a.m. MST) at 15°36′N 113°48′W / 15.6°N 113.8°W / 15.6; -113.8 (Sixteen-E reaches its lowest pressure.) – Tropical Depression Sixteen-E reaches a minimum barometric pressure of 1,006 mbar (29.71 inHg) about 565 mi (910 km) south-southwest of the southern tip of the Baja California peninsula.[34]
November 16
- 06:00 UTC (10:00 p.m. PST, November 15) at 14°42′N 116°42′W / 14.7°N 116.7°W / 14.7; -116.7 (Sixteen-E becomes a remnant low.) – Tropical Depression Sixteen-E degenerates into a remnant low about 715 mi (1,150 km) southwest of the southern tip of the Baja California peninsula.[34]
November 30
- The 2002 Pacific hurricane season officially ends.[1]
Notes
- ^ These totals exclude one tropical depression and one tropical storm that were tracked by the Japan Meteorological Agency (JMA) and/or the Joint Typhoon Warning Center (JTWC), but were not recognized as tropical cyclones by the National Hurricane Center (NHC) nor the Central Pacific Hurricane Center (CPHC), and therefore are not officially counted towards the 2002 Pacific hurricane season.
- ^ A major hurricane is a Pacific or Atlantic hurricane that reaches Category 3 or higher on the five-level Saffir–Simpson scale, with maximum sustained winds of at least 111 mph (179 km/h).[1]
- ^ While the Northeast and North Central Pacific hurricane database (HURDAT) lists a formation time of 00:00 UTC on August 25 for Tropical Depression Two-C – which eventually became Hurricane Ele – the CPHC stated in their seasonal summary that the system did not develop until 48 hours later.[2]
- ^ While HURDAT lists a formation time of 18:00 UTC on October 23 for Tropical Depression Three-C – which eventually became Hurricane Huko – the CPHC stated in their seasonal summary that the system did not develop until 24 hours later.[2]
- ^ Both HURDAT and the CPHC's year-end report on tropical cyclone activity in the Central Pacific list 15°42′N 179°06′W / 15.7°N 179.1°W / 15.7; -179.1 (Huko's final position in the Central Pacific according to HURDAT and the CPHC.) as Huko's final position east of the International Date Line without providing any best track data on the storm's tenure in the Western Pacific basin.[2][5] The JTWC and the International Best Track Archive for Climate Stewardship disagree with this assessment, listing Huko's final position east of the International Date Line as 15°30′N 178°36′W / 15.5°N 178.6°W / 15.5; -178.6 (Huko's final position in the Central Pacific according to IBTrACS and the JTWC.); they also contradict the former two sources by providing a best track for Huko in the Western Pacific basin.[17]: 185 [31]
- ^ On October 27, daylight saving time ended in most areas of the basin, which resulted in the gap between UTC and local time widening by one hour. Hawaii was not affected; the state has not observed daylight saving time since 1945.[32][33]
See also
 Tropical cyclones portal

- Timeline of the 2002 Atlantic hurricane season
- List of Pacific hurricanes
- Pacific hurricane season
- Tropical cyclones in 2002
References
- ^ a b c d e f "Tropical Cyclone Climatology". Miami, Florida: National Hurricane Center. Archived from the original on April 1, 2024. Retrieved April 3, 2024.
- ^ a b c d e f g h i j k l m n o p q r s t u v w x y z aa ab ac ad ae af ag Nash, Andy; et al. (May 2003). 2002 Central North Pacific Tropical Cyclones (PDF) (Report). Honolulu, Hawaii: Central Pacific Hurricane Center. Archived (PDF) from the original on April 18, 2024. Retrieved May 1, 2024.
- ^ a b c Franklin, James L.; et al. (October 1, 2003). "Eastern North Pacific Hurricane Season of 2002". Monthly Weather Review. 131 (10). American Meteorological Society: 2379–2393. Bibcode:2003MWRv..131.2379F. doi:10.1175/1520-0493(2003)131<2379:ENPHSO>2.0.CO;2. Archived from the original on January 25, 2022.
- ^ Masters, Jeff (November 28, 2018). "A Hyperactive 2018 Eastern Pacific Hurricane Season Ends". Weather Underground. The Weather Company. Archived from the original on May 16, 2024. Retrieved May 18, 2024.
- ^ a b c d National Hurricane Center; Hurricane Research Division; Central Pacific Hurricane Center (April 26, 2024). "The Northeast and North Central Pacific hurricane database 1949–2023". United States National Oceanic and Atmospheric Administration's National Weather Service. Archived from the original on May 29, 2024. A guide on how to read the database is available here.
 This article incorporates text from this source, which is in the public domain.
 - ^ October 2002 Global Hazards: Tropical Cyclones. National Centers for Environmental Information (Report). National Oceanic and Atmospheric Administration. November 2002. Archived from the original on September 5, 2022. Retrieved May 18, 2024.
- ^ National Hurricane Operations Plan (PDF). Office of the Federal Coordinator for Meteorological Services and Supporting Research (Report). Washington, D.C.: National Oceanic and Atmospheric Administration. May 2003. p. 3-8. Archived (PDF) from the original on May 1, 2024. Retrieved May 18, 2024.
- ^ Associated Press (September 26, 2002). "Tropical storm Julio hits Mexico". The Times. Shreveport, Louisiana: Gannett. Archived from the original on May 18, 2024. Retrieved May 18, 2024 – via Newspapers.com.
- ^ a b c d e f Franklin, James L. (June 24, 2002). Tropical Cyclone Report: Tropical Storm Boris (PDF) (Report). Miami, Florida: National Hurricane Center. Archived (PDF) from the original on December 16, 2023. Retrieved April 8, 2024.
- ^ a b c d e f Stewart, Stacy R. (November 10, 2002). Tropical Cyclone Report: Tropical Storm Iselle (PDF) (Report). Miami, Florida: National Hurricane Center. Archived (PDF) from the original on December 16, 2023. Retrieved May 5, 2024.
- ^ a b c d e Pasch, Richard J. (January 21, 2003). Abbreviated Tropical Cyclone Report: Tropical Depression Eleven-E (PDF) (Report). Miami, Florida: National Hurricane Center. Archived (PDF) from the original on July 8, 2022. Retrieved May 4, 2024.
- ^ Masters, Jeff (May 28, 2022). "Tropical Storm Agatha expected to be a rare and dangerous early-season hurricane for Mexico". Yale Climate Connections. Yale School of the Environment. Archived from the original on May 6, 2024. Retrieved May 18, 2024.
- ^ "Understanding the Date/Time Stamps". Silver Spring, Maryland: National Weather Service. Archived from the original on February 26, 2023. Retrieved March 21, 2024.
- ^ a b c d e f g h i j Stewart, Stacy R. (July 24, 2002). Tropical Cyclone Report: Hurricane Alma (PDF) (Report). Miami, Florida: National Hurricane Center. Archived (PDF) from the original on August 29, 2021. Retrieved April 3, 2024.
- ^ a b c Avila, Lixion A. (July 6, 2002). Tropical Cyclone Abbreviated Report: Tropical Depression Three-E (PDF) (Report). Miami, Florida: National Hurricane Center. Archived (PDF) from the original on July 9, 2022. Retrieved April 8, 2024.
- ^ a b c d e Lawrence, Miles B.; Blake, Eric (December 11, 2002). Tropical Cyclone Report: Tropical Storm Cristina (PDF) (Report). Miami, Florida: National Hurricane Center. Archived (PDF) from the original on December 16, 2023. Retrieved April 8, 2024.
- ^ a b c d 2002 Annual Tropical Cyclone Report (PDF) (Report). Joint Typhoon Warning Center. Archived from the original (PDF) on February 11, 2021. Retrieved May 12, 2024.
- ^ "台風0210号(0210 KALMAEGI)" (PDF) (in Japanese). Japan Meteorological Agency. Archived (PDF) from the original on May 12, 2024. Retrieved May 12, 2024.
- ^ Annual Report on Activities of the RSMC Tokyo – Typhoon Center 2002 (PDF) (Report). Japan Meteorological Agency. p. 15. Archived (PDF) from the original on December 14, 2022. Retrieved May 12, 2024.
- ^ a b c d e f g h i Pasch, Richard J. (December 13, 2002). Tropical Cyclone Report: Hurricane Douglas (PDF) (Report). Miami, Florida: National Hurricane Center. Archived (PDF) from the original on August 1, 2022. Retrieved April 8, 2024.
- ^ a b c d e f g h i j k l m Beven, Jack (December 13, 2002). Tropical Cyclone Report: Hurricane Elida (PDF) (Report). Miami, Florida: National Hurricane Center. Archived (PDF) from the original on July 7, 2022. Retrieved April 9, 2024.
- ^ a b c Beven, Jack (November 20, 2002). Tropical Cyclone Abbreviated Report: Tropical Depression Seven-E (PDF) (Report). Miami, Florida: National Hurricane Center. Archived (PDF) from the original on July 7, 2022. Retrieved April 18, 2024.
- ^ a b c d e f g h i j k l m n o p q r Franklin, James L. (December 6, 2002). Tropical Cyclone Report: Hurricane Fausto (PDF) (Report). Miami, Florida: National Hurricane Center. Archived (PDF) from the original on July 7, 2022. Retrieved May 1, 2024.
- ^ a b c d e f Avila, Lixion A. (October 12, 2002). Tropical Cyclone Report: Tropical Storm Genevieve (PDF) (Report). Miami, Florida: National Hurricane Center. Archived (PDF) from the original on December 12, 2023. Retrieved May 2, 2024.
- ^ a b c d e f g h i j k l m n Lawrence, Miles B. (December 10, 2002). Tropical Cyclone Report: Hurricane Hernan (PDF) (Report). Miami, Florida: National Hurricane Center. Archived (PDF) from the original on March 26, 2021. Retrieved May 2, 2024.
- ^ a b c d e Beven, Jack (December 11, 2002). Tropical Cyclone Report: Tropical Storm Julio (PDF) (Report). Miami, Florida: National Hurricane Center. Archived (PDF) from the original on December 16, 2023. Retrieved May 5, 2024.
- ^ a b c d e f g h i j k l Franklin, James L. (December 26, 2002). Tropical Cyclone Report: Hurricane Kenna (PDF) (Report). Miami, Florida: National Hurricane Center. Archived (PDF) from the original on December 1, 2023. Retrieved May 6, 2024.
- ^ a b c d e f g h i Avila, Lixion A. (December 27, 2002). Tropical Cyclone Report: Tropical Storm Lowell (PDF) (Report). Miami, Florida: National Hurricane Center. Archived (PDF) from the original on December 12, 2023. Retrieved May 6, 2024.
- ^ "台風0223号(0223 MAYSAK)" (PDF) (in Japanese). Japan Meteorological Agency. Archived (PDF) from the original on May 12, 2024. Retrieved May 12, 2024.
- ^ Padgett, Gary (December 27, 2006). Monthly Global Tropical Cyclone Summary October 2002. Australian Severe Weather (Report). Archived from the original on December 5, 2023. Retrieved May 12, 2024.
- ^ "2002 Hurricane HUKO (2002297N09206)". International Best Track Archive for Climate Stewardship. North Carolina Institute for Climate Studies. Archived from the original on May 10, 2024. Retrieved May 10, 2024.
- ^ "Time to fall back". CNN. Atlanta, Georgia. October 27, 2002. Archived from the original on May 13, 2024. Retrieved May 13, 2024.
- ^ Enten, Harry (March 12, 2022). "The Daylight Saving Time debate is nothing to lose sleep over". CNN. Atlanta, Georgia. Archived from the original on March 31, 2024. Retrieved May 13, 2024.
- ^ a b c d Lawrence, Miles B. (December 4, 2002). Abbreviated Tropical Cyclone Report: Tropical Depression Sixteen-E (PDF) (Report). Miami, Florida: National Hurricane Center. Archived (PDF) from the original on July 9, 2022. Retrieved May 10, 2024.
External links
Wikimedia Commons has media related to 2002 Pacific hurricane season.
- The National Hurricane Center's advisory archive for 2002


