Spatial weight matrix
Neighbor Matrix
The concept of a spatial weight is used in spatial analysis to describe neighbor relations between regions on a map.[1] If location is a neighbor of location then otherwise . Usually (though not always) we do not consider a site to be a neighbor of itself[2] so . These coefficients are encoded in the spatial weight matrix


Where is the number of sites under consideration. The spatial weight matrix is a key quantity in the computation of many spatial indices like Moran's I, Geary's C, Getis-Ord statistics and Join Count Statistics.

Contiguity-Based Weights


This approach considers spatial sites as nodes in a graph with links determined by a shared boundary or vertex.[3] The elements of the spatial weight matrix are determined by setting for all connected pairs of nodes with all the other elements set to 0. This makes the spatial weight matrix equivalent to the adjacency matrix of the corresponding network. It is common[2] to row-normalize the matrix ,


In this case the sum of all the elements of equals the number of sites.
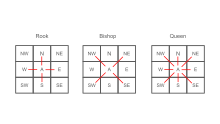
There are three common methods for linking sites[3] named after the chess pieces which make similar moves:
- Rook: sites are neighbors if they share an edge
- Bishop: sites are neighbours if they share a vertex
- Queen: sites are neighbours if they share an edge or a vertex
In some cases statistics can be quite different depending on the definition used, especially for discrete data on a grid.[3] There are also other cases where the choice of neighbors is not obvious and can affect the outcome of the analysis. Bivand and Wong[4] describe a situation where the value of spatial indices of association (like Moran's I) depend on the inclusion or exclusion of a ferry crossing between counties. There are also cases where regions meet in a tripoint or quadripoint where Rook and Queen neighborhoods can differ.
Distance-Based Weights
Another way to define spatial neighbors is based on the distance between sites. One simple choice is to set for every pair separated by a distance less than some threshold .[5] Cliff and Ord[1] suggest the general form


Where is some function of the distance between and and is the proportion of the perimeter of in contact with . The function


is then suggested. Often the term is not included and the most common values for are 1 and 2.[3] Another common choice for the distance decay function is[6]


though a number of different Kernel functions can be used. The exponential and other Kernel functions typically set which must be considered in applications.

It is possible to make the spatial weight matrix a function of 'distance class':[7] where denotes the 'distance class', for example corresponding to first, second, third etc. neighbors. In this case, functions of the spatial weight matrix become distance class dependent. For example, Moran's I is


This defines a type of spatial correlogram, in this case, since Moran's I measures spatial autocorrelation, measures how the autocorrelation of the data changes as a function of distance class. Remembering Tobler's first law of geography, "everything is related to everything else, but near things are more related than distant things" it usually decreases with distance.

Common distance functions include[5] Euclidean distance, Manhattan distance and Great-circle distance.
Spatial Lag
One application of the spatial weight matrix is to compute the spatial lag[8]
![{\displaystyle [Wx]_{i}=\sum _{j}w_{ij}x_{j}}](https://wikimedia.org/api/rest_v1/media/math/render/svg/4b99cbb81aa07ffc969416b7453ebdb31418dbf9)
For row-standardised weights initially set to and with , is simply the average value observed at the neighbors of . These lagged variables can then be used in regression analysis to incorporate the dependence of the outcome variable on the values at neighboring sites.[9] The standard regression equation is
![{\displaystyle [Wx]_{i}}](https://wikimedia.org/api/rest_v1/media/math/render/svg/3f210926a2d14b496cff128dc5d58a478e3e61ce)

The spatial lag model adds the spatial lag vector to this

where is a parameter which controls the degree of autocorrelation of .[10] This is similar to an autoregressive model in the analysis of time series.


See Also
References
- ^ a b Cliff, A.D. and Ord, J.K. (1981). Spatial Processes: Models & Applications. Pion. ISBN 9780850860818.
{{cite book}}: CS1 maint: multiple names: authors list (link) - ^ a b "Contiguity-Based Spatial Weights".
- ^ a b c d Dale MR, Fortin MJ. Spatial analysis: a guide for ecologists. Cambridge University Press; 2014 Sep 11.
- ^ Bivand RS, Wong DW. Comparing implementations of global and local indicators of spatial association. Test. 2018 Sep;27(3):716-48.
- ^ a b "Distance-Band Spatial Weights".
- ^ "Spatial Weights as Distance Functions".
- ^ Legendre P, Legendre L. Numerical ecology. Elsevier; 2012 Jul 21.
- ^ "Applications of Spatial Weights".
- ^ Anselin L, Griffith DA. Do spatial effecfs really matter in regression analysis?. Papers in Regional Science. 1988 Jan 1;65(1):11-34.
- ^ Seya H, Yoshida T, Yamagata Y. Spatial econometric models. InSpatial Analysis Using Big Data 2020 Jan 1 (pp. 113-158). Academic Press.


