2021 UK local government election
2021 North Northamptonshire Council election |
78 seats on North Northamptonshire Council 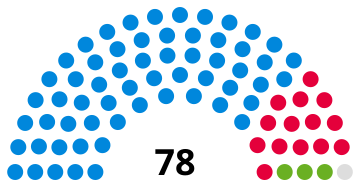 |
|---|
| | First party | Second party | Third party | | | | | | | Party | Conservative | Labour | Green | | Seats won | 60 | 14 | 3 | | Popular vote | 124,537 | 69,258 | 16,701 | | Percentage | 53.2% | 29.6% | 7.1% |
| | | Fourth party | Fifth party | Sixth party | | | | | | | Party | Independent | Liberal Democrats | Reform UK | | Seats won | 1 | 0 | 0 | | Popular vote | 6,196 | 16,348 | 498 | | Percentage | 2.6% | 7.0% | 0.2% |
| | | Seventh party | | | | | | | Party | Alliance for Democracy and Freedom | | | Seats won | 0 | | | Popular vote | 100 | | | Percentage | 0.04% | | |
The 2021 North Northamptonshire Council election took place alongside nationwide local elections. The election was originally due to take place in May 2020, but was postponed due to the COVID-19 pandemic.[1]
It was the inaugural election for the unitary authority, which was created one month before in April 2021, after the merger of the four existing non-metropolitan districts of Corby, East Northamptonshire, Kettering, and Wellingborough. North Northamptonshire absorbed the functions of these districts, plus those of the abolished Northamptonshire County Council. All 26 wards elect 3 councillors each, resulting in 78 councillors being elected and 40 seats being required for a majority.[2]
Results by Division
Corby
Corby Rural | Party | Candidate | Votes | % |
| | Conservative | David John Sims | 1,955 | 57.6 |
| | Conservative | Kevin Gordon Sydney | 1,888 | 55.6 |
| | Conservative | Macaulay Andrew Nichol | 1,857 | 54.7 |
| | Labour | Ann Wallington | 1,506 | 44.3 |
| | Labour | Ray Beeby | 1,376 | 40.5 |
| | Labour | Guy Longfoot-Finch | 1,102 | 32.4 |
| | Green | Stevie Jones | 484 | 14.3 |
| | Liberal Democrats | Judith Ann Brown | 341 | 10.0 |
| Turnout | 3,396 | 40.2 |
Corby West | Party | Candidate | Votes | % |
| | Labour | Jean Gloria Addison | 2,062 | 62.2 |
| | Labour | Alison Dalziel | 2,044 | 61.7 |
| | Labour | Matt Keane | 1,946 | 58.7 |
| | Conservative | Rosalie Susan Beattie | 853 | 25.7 |
| | Conservative | Glenvil Greenwood-Smith | 776 | 23.4 |
| | Conservative | Peter Wathen | 754 | 22.8 |
| | Green | Lynne Scannell | 225 | 6.8 |
| | Liberal Democrats | Philip Charles Bromhall | 149 | 4.5 |
| Turnout | 3,313 | 36.1 |
Kingswood | Party | Candidate | Votes | % |
| | Labour | John Adam McGhee | 1,619 | 57.1 |
| | Labour | Zoe Catherine McGhee | 1,477 | 52.1 |
| | Labour | Peter Welsh McEwan | 1,447 | 51.0 |
| | Conservative | Ray Boyd | 724 | 25.5 |
| | Conservative | Raymond George Jackson | 711 | 25.1 |
| | Conservative | Robert John Tustin | 642 | 22.6 |
| | Green | Michael Mahon | 312 | 11.0 |
| | Liberal Democrats | James Edward McGeown | 153 | 5.4 |
| Turnout | 2,835 | 27.3 |
Lloyds | Party | Candidate | Votes | % |
| | Labour | Mark Pengelly | 2,338 | 70.5 |
| | Labour | Lyn Buckingham | 2,212 | 66.7 |
| | Labour | William George Colquhoun | 1,852 | 55.8 |
| | Conservative | Cameron Steven Andrew Clarke | 783 | 23.6 |
| | Conservative | Jayden Watts | 691 | 20.8 |
| | Conservative | Cesare Marinaro | 642 | 19.3 |
| | Green | Lee Forster | 491 | 14.8 |
| | Liberal Democrats | Terri Meechan | 162 | 4.9 |
| Turnout | 3,318 | 33.6 |
Oakley | Party | Candidate | Votes | % |
| | Labour | Ross Armour | 1,491 | 41.7 |
| | Labour | Simon Rielly | 1,482 | 41.4 |
| | Labour | Leanne Norma Louise Buckingham | 1,334 | 37.3 |
| | Conservative | Lorna Michele Rowan Garner | 1,177 | 32.9 |
| | Conservative | Ollie Curtis | 1,176 | 32.9 |
| | Conservative | Alexandra Katharine Wellings | 1,116 | 31.2 |
| | Liberal Democrats | Chris Stanbra | 969 | 27.1 |
| | Liberal Democrats | Penny Smith | 444 | 12.4 |
| | Liberal Democrats | Aidan O'Donovan | 439 | 12.3 |
| Turnout | 3,576 | 35.5 |
[3]
Higham Ferrers | Party | Candidate | Votes | % |
| | Conservative | Bert Jackson | 1,854 | 56.0 |
| | Conservative | Jennie Bone | 1,683 | 50.8 |
| | Conservative | Harriet Jane Frances Pentland | 1,681 | 50.8 |
| | Independent | Richard Joseph Gell | 708 | 21.4 |
| | Labour | Judy Dorothy Caine | 636 | 19.2 |
| | Labour | David Leslie Baker | 613 | 18.5 |
| | Independent | Peter Tomas | 587 | 17.7 |
| | Green | Marnie Fedorowycz | 487 | 14.7 |
| | Liberal Democrats | David Hooton | 405 | 12.2 |
| | Reform UK | Sean Robert John Lever | 149 | 4.5 |
| Turnout | 3,311 | 29.9 |
Irthlingborough | Party | Candidate | Votes | % |
| | Conservative | Dorothy Maxwell | 1,817 | 50.4 |
| | Conservative | Kirk William Oliver Harrison | 1,770 | 49.1 |
| | Conservative | Roger Stuart Powell | 1,763 | 48.9 |
| | Labour | Caroline Cross | 1,288 | 35.7 |
| | Labour | Jon Gray | 1,137 | 31.5 |
| | Labour | Caroline Smith | 788 | 21.8 |
| | Green | Joel Wylie | 590 | 16.4 |
| | Liberal Democrats | Susan Smith | 267 | 7.4 |
| | Reform UK | Matt Davies | 151 | 4.2 |
| Turnout | 3,607 | 31.5 |
Oundle | Party | Candidate | Votes | % |
| | Conservative | Annabel Lucy de Capell Brooke | 2,831 | 55.5 |
| | Conservative | Helen Jane Harrison | 2,281 | 44.7 |
| | Conservative | Jason Smithers | 2,133 | 41.8 |
| | Liberal Democrats | Charlie Best | 1,606 | 31.5 |
| | Liberal Democrats | Caroline Campbell Yeo | 1,212 | 23.8 |
| | Labour | Harry Edward James | 936 | 18.4 |
| | Green | Luke Jones | 867 | 17.0 |
| | Independent | Peter David Peel | 283 | 5.6 |
| | Independent | Phillip Maynard Stearn | 217 | 4.3 |
| Turnout | 5,099 | 40.5 |
Raunds | Party | Candidate | Votes | % |
| | Conservative | Helen Victoria Mary Howell | 2,095 | 66.8 |
| | Conservative | Richard John Kenneth Levell | 1,949 | 62.1 |
| | Conservative | Lee Robert Charles Wilkes | 1,873 | 59.7 |
| | Labour | Pauline Mary Ellis | 614 | 19.6 |
| | Labour | Neil Harvey | 540 | 17.2 |
| | Labour | Sheila Elizabeth Harvey | 519 | 16.5 |
| | Green | Julia Thorley | 408 | 13.0 |
| | Liberal Democrats | Garth Ratcliffe | 307 | 9.8 |
| Turnout | 3,136 | 29.0 |
Rushden Pemberton West | Party | Candidate | Votes | % |
| | Conservative | Barbara Jenney | 1,981 | 63.5 |
| | Conservative | Michael Tye | 1,943 | 62.2 |
| | Conservative | Gill Mercer | 1,766 | 56.6 |
| | Labour | Gail McDade | 687 | 22.0 |
| | Labour | Gary Hugh Day | 666 | 21.3 |
| | Liberal Democrats | Joe Norris | 581 | 18.6 |
| | Green | Grace Siddington | 530 | 17.0 |
| Turnout | 3,122 | 28.2 |
Rushden South | Party | Candidate | Votes | % |
| | Conservative | David Jenney | 1,894 | 59.6 |
| | Conservative | Steven John Brian North | 1,810 | 57.0 |
| | Conservative | Andy Mercer | 1,680 | 52.9 |
| | Labour | Les Rolfe | 849 | 26.7 |
| | Labour | Daniel James Ash | 714 | 22.5 |
| | Green | Keiron Farrow | 575 | 18.1 |
| | Liberal Democrats | Liam Wilson | 514 | 16.2 |
| Turnout | 3,177 | 22.9 |
Thrapston | Party | Candidate | Votes | % |
| | Conservative | Wendy Jane Brackenbury | 2,746 | 55.6 |
| | Conservative | David Hereward Gibson Brackenbury | 2,526 | 51.1 |
| | Conservative | Geoff Shacklock | 2,117 | 42.8 |
| | Independent | Val Carter | 1,712 | 34.6 |
| | Labour | Paul George Kirkpatrick | 782 | 15.8 |
| | Green | Hope Carpenter | 708 | 14.3 |
| | Labour | Jerry Hawkins | 647 | 13.1 |
| | Labour | Taffy Chikoto | 599 | 12.1 |
| | Liberal Democrats | Jack Duckworth | 398 | 8.1 |
| | Independent | John Allan Smoker | 370 | 7.5 |
| | Liberal Democrats | Iris Amanda Lerse | 349 | 7.1 |
| Turnout | 4,943 | 37.9 |
Burton & Broughton | Party | Candidate | Votes | % |
| | Conservative | Jan O'Hara | 1,543 | 49.2 |
| | Conservative | John Richard Currall | 1,541 | 49.1 |
| | Conservative | Chris Smith-Haynes | 1,120 | 35.7 |
| | Green | Adrian Watts | 1,004 | 32.0 |
| | Liberal Democrats | Chris Groome | 920 | 29.3 |
| | Liberal Democrats | Jenny Davies | 786 | 25.0 |
| | Independent | Fergus Macdonald | 598 | 19.1 |
| | Labour | Mark Anthony Sales | 519 | 16.5 |
| Turnout | 3,139 | 27.5 |
Clover Hill | Party | Candidate | Votes | % |
| | Green | Dez Dell | 2,184 | 59.8 |
| | Green | Emily-Rose Fedorowycz | 1,780 | 48.7 |
| | Green | Sarah Tubbs | 1,726 | 47.3 |
| | Conservative | Lesley Anne Thurland | 1,087 | 29.8 |
| | Conservative | Ash Davies | 1,002 | 27.4 |
| | Conservative | Greg Titcombe | 887 | 24.3 |
| | Independent | Bill Parker | 480 | 13.1 |
| | Labour | Bryan Bremner Massie | 442 | 12.1 |
| | Labour | Martyn Reuby | 355 | 9.7 |
| | Independent | Derek Hilling | 120 | 3.3 |
| | ADF | Suzanne Brogan | 100 | 2.7 |
| Turnout | 3,652 | 37.1 |
Desborough | Party | Candidate | Votes | % |
| | Conservative | Mike Tebbutt | 2,011 | 50.9 |
| | Conservative | Mark Robert Dearing | 1,981 | 50.1 |
| | Conservative | David Alexander Howes | 1,791 | 45.3 |
| | Labour | Phil Sawford | 1,393 | 35.2 |
| | Labour | Andy Coleman | 956 | 24.2 |
| | Labour | Yvonne Claire Scarrott | 791 | 20.0 |
| | Independent | Linda Valerie Burnham | 707 | 17.9 |
| | Liberal Democrats | Alan James Window | 493 | 12.5 |
| | Green | Stevie Lawless | 455 | 11.5 |
| Turnout | 3,954 | 33.3 |
Ise | Party | Candidate | Votes | % |
| | Conservative | Lloyd Bunday | 1,871 | 55.2 |
| | Conservative | Mark Edward Rowley | 1,817 | 53.6 |
| | Conservative | Elliot Keith Prentice | 1,731 | 51.1 |
| | Labour | John David Padwick | 1,048 | 30.9 |
| | Labour | Jane Pettit | 816 | 24.1 |
| | Labour | Tim Sharman | 652 | 19.2 |
| | Green | David Lomasney | 647 | 19.1 |
| | Liberal Democrats | Ryan James White | 338 | 10.0 |
| Turnout | 3,390 | 34.5 |
Northall | Party | Candidate | Votes | % |
| | Conservative | Kevin Nigel Thurland | 1,394 | 42.9 |
| | Conservative | Anup Kumar Pandey | 1,392 | 42.9 |
| | Conservative | Ian Frederick Jelley | 1,326 | 40.8 |
| | Labour | Keli Ryan Watts | 1,309 | 40.3 |
| | Labour | Andy Byatt | 1,249 | 38.5 |
| | Labour | Clare Patricia Meechan Pavitt | 1,107 | 34.1 |
| | Liberal Democrats | Stephen Michael Silver | 439 | 13.5 |
| Turnout | 3,247 | 26.6 |
Rothwell & Mawsley | Party | Candidate | Votes | % |
| | Independent | Jim Hakewill | 1,940 | 52.5 |
| | Conservative | Cedwien Margaret Brown | 1,847 | 50.0 |
| | Conservative | Joseph John Smyth | 1,489 | 40.3 |
| | Conservative | Cliff Moreton | 1,424 | 38.6 |
| | Green | Sarah Musselwhite | 827 | 22.4 |
| | Labour | Isobel Victoria Stevenson | 726 | 19.7 |
| | Labour | Robert Charles Newby | 620 | 16.8 |
| Turnout | 3,693 | 31.0 |
Wicksteed | Party | Candidate | Votes | % |
| | Conservative | Scott Anthony Edwards | 1,695 | 47.3 |
| | Conservative | Russell Roberts | 1,621 | 45.3 |
| | Conservative | Larry Henson | 1,504 | 42.0 |
| | Liberal Democrats | Andrew Rivers George Dutton | 970 | 27.1 |
| | Labour | Adam Balmer | 819 | 22.9 |
| | Labour | Geoff Marshall | 814 | 22.7 |
| | Labour | Kat Ivanova | 799 | 22.3 |
| | Liberal Democrats | Christopher George McGlynn | 760 | 21.2 |
| | Liberal Democrats | Chris Nelson | 590 | 16.5 |
| | Reform UK | Jehad Soliman Aburamadan | 198 | 5.5 |
| Turnout | 3,582 | 31.7 |
Windmill | Party | Candidate | Votes | % |
| | Conservative | Robin John Carter | 1,184 | 48.0 |
| | Labour | Anne Marie B Lee | 1,068 | 43.3 |
| | Conservative | Paul Marks | 1,037 | 42.0 |
| | Conservative | Craig Skinner | 1,014 | 41.1 |
| | Labour | Clark James Mitchell | 915 | 37.1 |
| | Labour | Arlette Cindy Wrighting | 915 | 37.1 |
| | Independent | Glenn Binley | 186 | 7.5 |
| | Liberal Democrats | Mel Gosliga | 185 | 7.5 |
| Turnout | 2,467 | 24.6 |
Brickhill & Queensway | Party | Candidate | Votes | % |
| | Conservative | Paul Anthony Bell | 1,455 | 50.1 |
| | Conservative | Matt Binley | 1,374 | 47.3 |
| | Conservative | King Babatunda Oloruntoba Adeboye Lawal | 1,199 | 41.3 |
| | Labour | Adam William Henley | 1,015 | 34.9 |
| | Labour | Sylvia Rosetta Erskine | 956 | 32.9 |
| | Labour | Andrea Jayne Watts | 868 | 29.9 |
| | Liberal Democrats | Carolyn Frances Ramsbottom | 316 | 10.9 |
| Turnout | 2,906 | 31.0 |
Croyland & Swanspool | Party | Candidate | Votes | % |
| | Conservative | Tim Allebone | 1,204 | 44.3 |
| | Labour | Valerie Frances Anslow | 1,180 | 43.4 |
| | Conservative | Philip Todd Irwin | 1,162 | 42.8 |
| | Labour | Samuel Lewis Shoesmith | 1,012 | 37.3 |
| | Conservative | Brian Kevin Skittrall | 998 | 36.7 |
| | Labour | Andrew Michael Julian Scarborough | 988 | 36.4 |
| | Liberal Democrats | Neale Robert William McMaster | 323 | 11.9 |
| Turnout | 2,716 | 27.5 |
Earls Barton | Party | Candidate | Votes | % |
| | Conservative | Clive Frederick Hallam | 2,551 | 59.8 |
| | Conservative | Scott Phillip Brown | 2,468 | 57.9 |
| | Conservative | Lora Lawman | 2,440 | 57.2 |
| | Green | Olivia Mitchell | 1,160 | 27.2 |
| | Labour | Ian Peter Stroud | 1,028 | 24.1 |
| | Liberal Democrats | Paula Jane Addison-Pettit | 976 | 22.9 |
| Turnout | 4,266 | 41.8 |
Finedon | Party | Candidate | Votes | % |
| | Conservative | Jonathan Ekins | 1,491 | 44.5 |
| | Conservative | Malcolm John Seeney Ward | 1,457 | 43.5 |
| | Conservative | Andrew James Weatherill | 1,424 | 42.5 |
| | Labour | Tony Aslam | 1,314 | 39.3 |
| | Labour | Elayne Francis | 1,096 | 32.7 |
| | Labour | Anthony David Dady | 1,017 | 30.4 |
| | Green | Sarah Pearson | 508 | 15.2 |
| | Liberal Democrats | John George Ramsbottom | 345 | 10.3 |
| Turnout | 3,347 | 31.4 |
Hatton Park | Party | Candidate | Votes | % |
| | Conservative | Ken Harrington | 2,137 | 59.5 |
| | Conservative | Graham Michael Lawman | 2,062 | 57.4 |
| | Conservative | Malcolm Waters | 1,778 | 49.5 |
| | Labour | Clare Margaret Anne Thomson | 1,029 | 28.6 |
| | Labour | William Inskip | 976 | 27.2 |
| | Labour | Stuart George Scott | 793 | 22.1 |
| | Liberal Democrats | Stuart James Simons | 332 | 9.2 |
| Turnout | 3,592 | 35.6 |
Irchester | Party | Candidate | Votes | % |
| | Conservative | Jon-Paul Carr | 2,108 | 58.1 |
| | Conservative | Tom Partridge-Underwood | 2,105 | 58.1 |
| | Conservative | Martin James Griffiths | 1,837 | 50.7 |
| | Labour | Tim Maguire | 1,037 | 28.6 |
| | Labour | Michele Anne Milroy | 587 | 16.2 |
| | Independent | Jo Beirne | 577 | 15.9 |
| | Labour | John Edward Farrar | 552 | 15.2 |
| | Green | Will Morris | 393 | 10.8 |
| | Liberal Democrats | David Michael Brown | 280 | 7.7 |
| Turnout | 3,626 | 44.3 |
[4]
By-elections
Oundle
A by-election was held to fill the seat vacated by Cllr Annabel de Capell Brooke.[5]
Oundle: 17 February 2022 | Party | Candidate | Votes | % | ±% |
| | Liberal Democrats | Charlie Best | 1,683 | 47.2 | +22.6 |
| | Conservative | Ollie Curtis | 1,423 | 39.9 | -3.5 |
| | Labour | Harry James | 337 | 9.4 | -4.9 |
| | Green | Kate Jones | 124 | 3.5 | -9.8 |
| Majority | 260 | 7.3 | N/A |
| Turnout | 3,577 | 35.5 | -5.0 |
| | Liberal Democrats gain from Conservative | Swing |  13.1 13.1 | |
Northall
A by-election was held on 2 February 2023 due to the death of Cllr Kevin Thurland.
Northall: 2 February 2023 | Party | Candidate | Votes | % | ±% |
| | Labour | Keli Watts | 1,027 | 38.0 | -3.7 |
| | Conservative | Lesley Thurland | 805 | 29.8 | -14.6 |
| | Green | Ria Skelton | 658 | 24.4 | +24.4 |
| | Liberal Democrats | Stephen Silver | 127 | 4.7 | -9.2 |
| | Reform UK | Jehad Aburamadan | 85 | 3.1 | +3.1 |
| Majority | 222 | 8.4 | N/A |
| Turnout | 2,702 | | |
| | Labour gain from Conservative | Swing | 10.9 | |
Rushden South
Rushden South: 23 March 2023 | Party | Candidate | Votes | % | ±% |
| | Conservative | Anne Melanie Coleman | 1,210 | 54.6 | +5.2 |
| | Labour | Chris Ashton | 638 | 28.8 | +6.6 |
| | Liberal Democrats | Blythe Cassandra Avery | 157 | 7.1 | -6.3 |
| | Breakthrough Party | Dave Merlane | 120 | 5.4 | +5.4 |
| | Green | Will Morris | 93 | 4.2 | -10.8 |
| Majority | 572 | 25.8 | |
| Turnout | | 19.3 | |
| | Conservative hold | Swing | -1.4 | |
Desborough
}}
Desborough: 4 April 2024 | Party | Candidate | Votes | % | ±% |
| | Conservative | Bill McElhinney | 1,485 | 47.3% | |
| | Labour | Richard Tod | 1,055 | 33.6% | |
| | Green | Olivia Stevenson | 368 | 11.7% | -0.8% |
| | Liberal Democrats | Alan Windows | 234 | 7.5% | -5.0% |
| Turnout | 3,142 | | |
| | Conservative hold | Swing | | |
References
- ^ "Coronavirus: English local elections postponed for a year". BBC News. 13 March 2020. Retrieved 26 March 2021.
- ^ "Elections". North Northamptonshire Council. Archived from the original on 14 April 2021. Retrieved 4 April 2021.
- ^ "Results". North Northamptonshire Council. 6 May 2021. Retrieved 8 May 2021.
- ^ "Results". North Northamptonshire Council. 6 May 2021. Retrieved 8 May 2021.
- ^ "Notice of Vacancy in the office of Councillor - Oundle ward | North Northamptonshire Council". www.northnorthants.gov.uk. Retrieved 6 January 2022.

 13.1
13.1 
 Council elections in Northamptonshire


